Confidence Scores in Tractor Zoom Pro indicate how confident we are in the calculated value of your Make/Model based upon factors like available comps, data completeness, data outliers, and more. We dig into the factors below so you can better understand its purpose and how to utilize it.
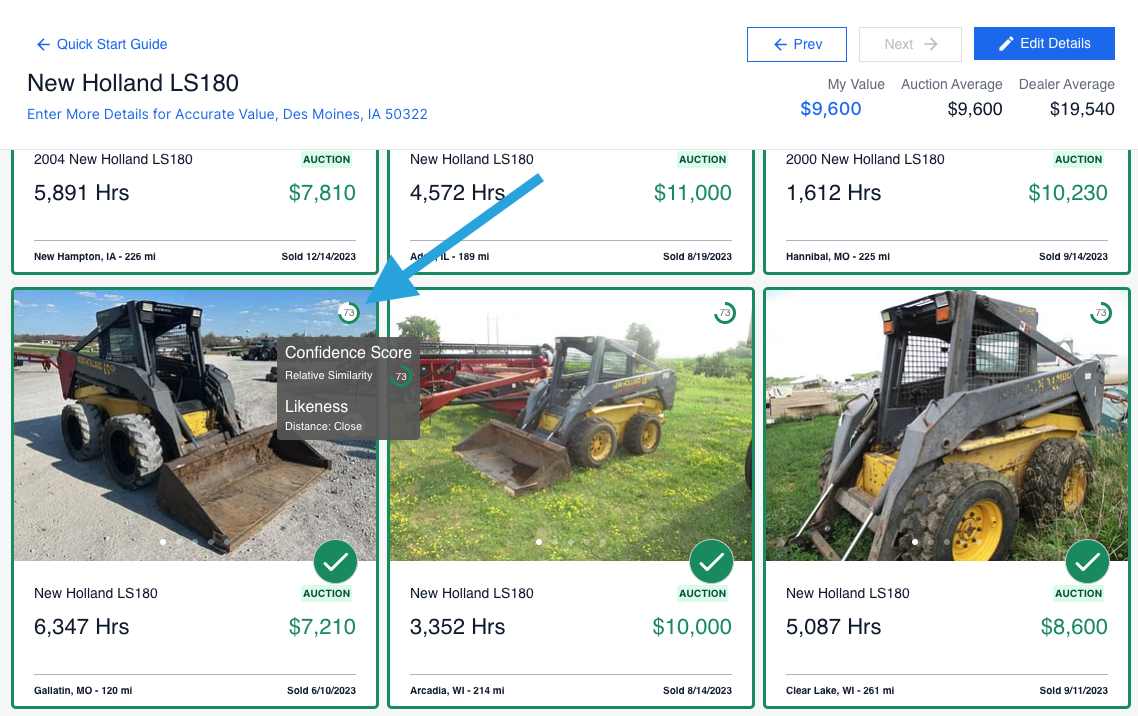
Relative Similarity
This factor of the confidence score accounts for the equipment details you placed into the system. We call those details “attributes." We will then rank the machines in order of distance to the input equipment to choose the most relevant matches.
Price Range of Comps
For equipment like sprayers, there are likely to be a few features that are not cataloged in our system. When this is the case, we might find 10 attributes that we think are the best comps, but find that the 10 lots are actually quite different from each other. The theory here is that if all the selected comps are close in value, the equipment likely follows a predictable price pattern based on the attributes we are tracking.
Usage Outlier
Sometimes a piece of equipment might be a bit of a unicorn. Let's look at a hypothetical scenario of a tractor model used between 2010 to 2020. One 2020 model (it is 2023 in this scenario) sat on a dealer’s lot for two years without getting sold. It then is sent to auction. We can run a search for a 3-year-old tractor with only 100 hours and most of the sale results for this tractor are going to have 3-13 years of usage. In this case, we match 10 lots that are three years old and have between about 500-750 hours. Those 10 comps will have a high Relative Similarity score because there are also lots that are 13 years old with 5,000 hours. Additionally, they might have a high Price Range of Comps score because all 10 are very similar to each other.
Need more help understanding Confidence Scores? Reach out to Jesse Scott with your questions.