With Tractor Zoom Pro Market Trends, you can access real-time and historic average movement of equipment prices. Use this feature to gain insights into specific Makes/Models sold at auction or listed on dealers’ lots, plus analyze the market as a whole.
Market Trends arms you with more detailed knowledge of equipment values and activity in the industry so that you’re making the most informed decisions when assessing overall risk for your organization.
In addition, the solution streamlines your research with all data (over $53B of used equipment sale data) at your fingertips, in one location. Learn about the variety of ways to utilize Market Trends below.
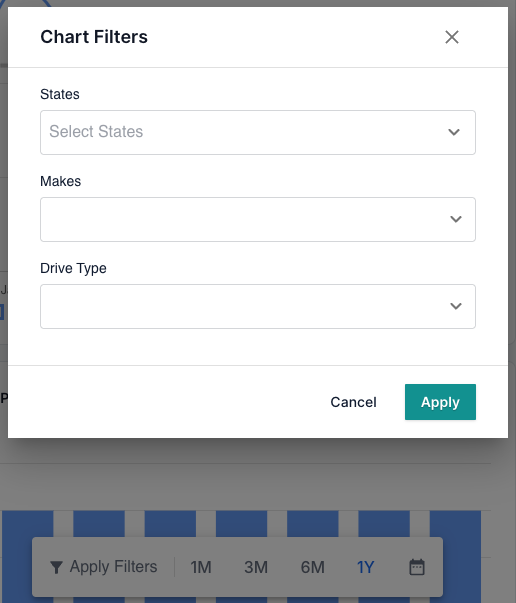
Apply Chart Filters
When evaluating trends, you may refine the data by applying filters and time ranges. Select either on the filters bar at the bottom of your screen.
Here, you can choose to view results by one month (1M), three months (3M), six months (6M), one year (1Y), or a custom range of dates.
You may also select State, Make, and Drive Type depending on the category of equipment.
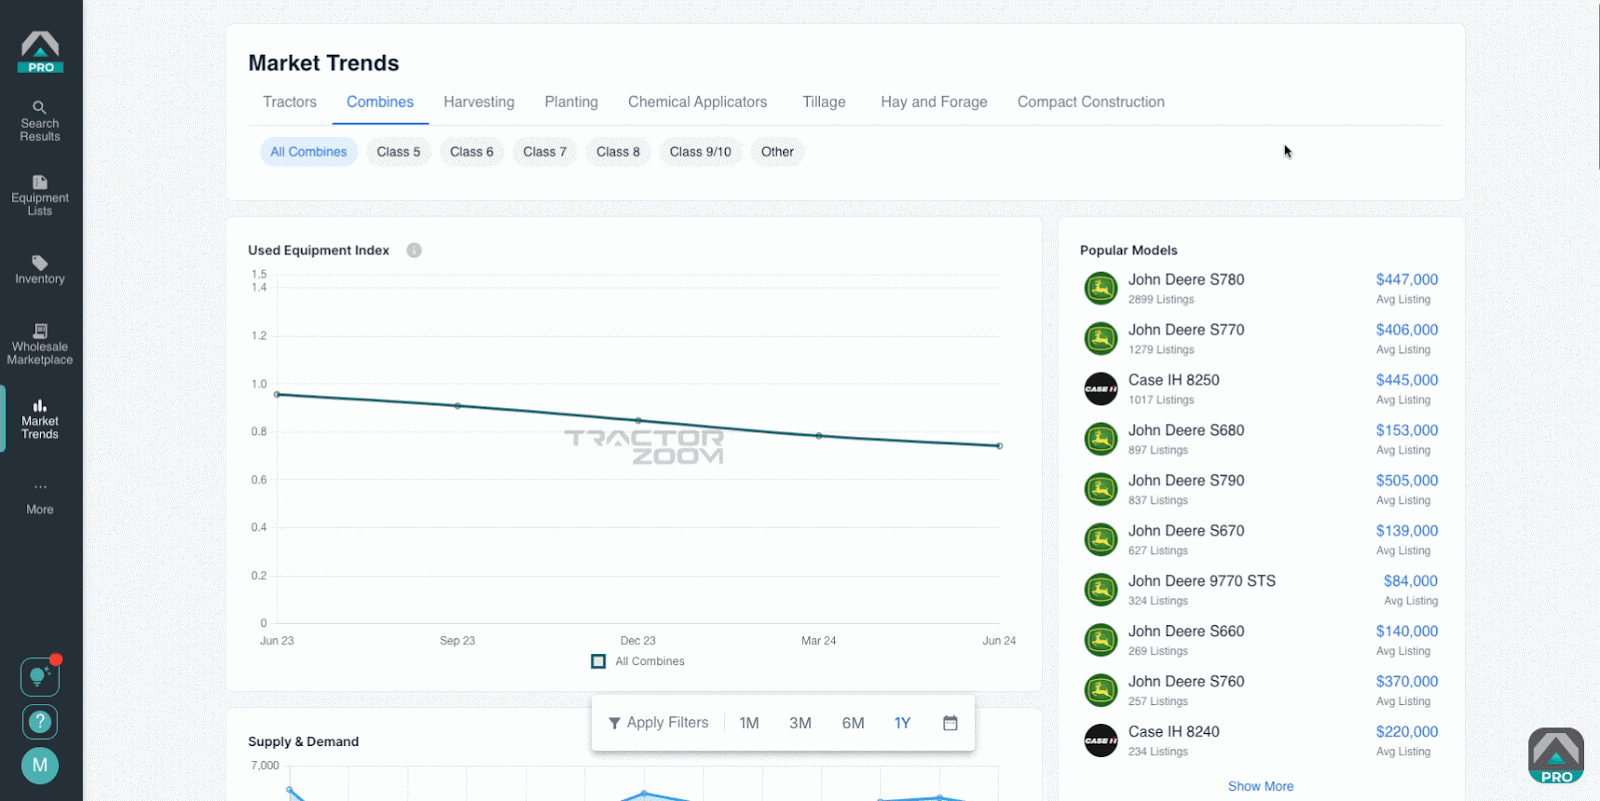
Used Equipment Index
The Used Equipment Index averages sale prices for equipment during a specific month and compares them to a baseline period.
Popular Models
Models with the most volume populate this list, in addition to the average listing price for each model. Choose a range of time to refine the listings. Click on a model for an expanded view of supply and pricing trends.
Price Changes
The Price Changes section displays equipment make and models that have experienced the most dramatic price changes. Click on a make and model for an expanded view of pricing trends and select the date range you wish to view.
Dealer Price Changes
See the frequency of price changes on your selected category over time.
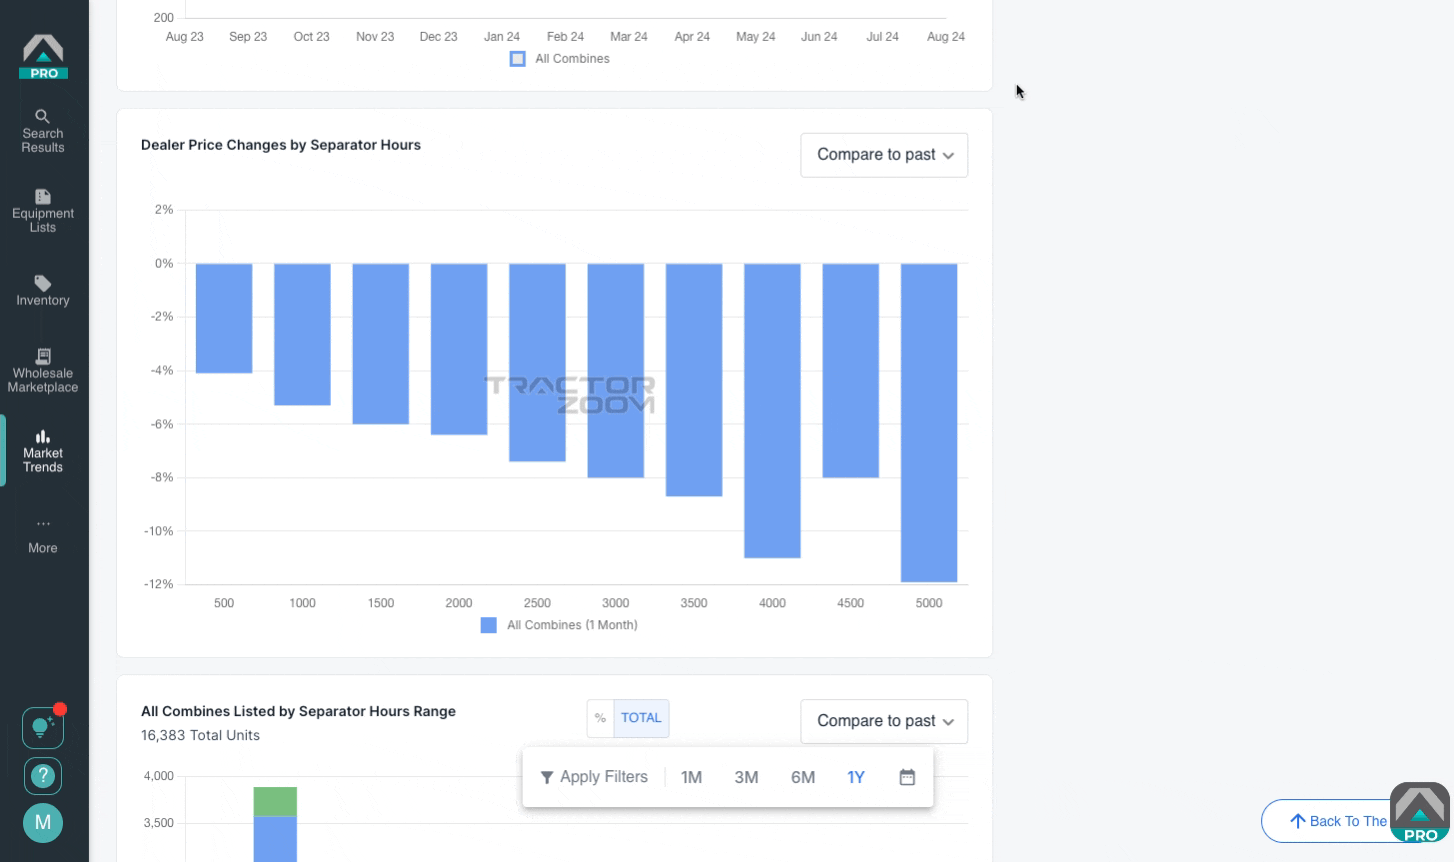
Dealer Price Changes by Hours
This section displays data about equipment price changes depending on the hour range. Click the Compare to past drop down to select a specific month for price comparison.
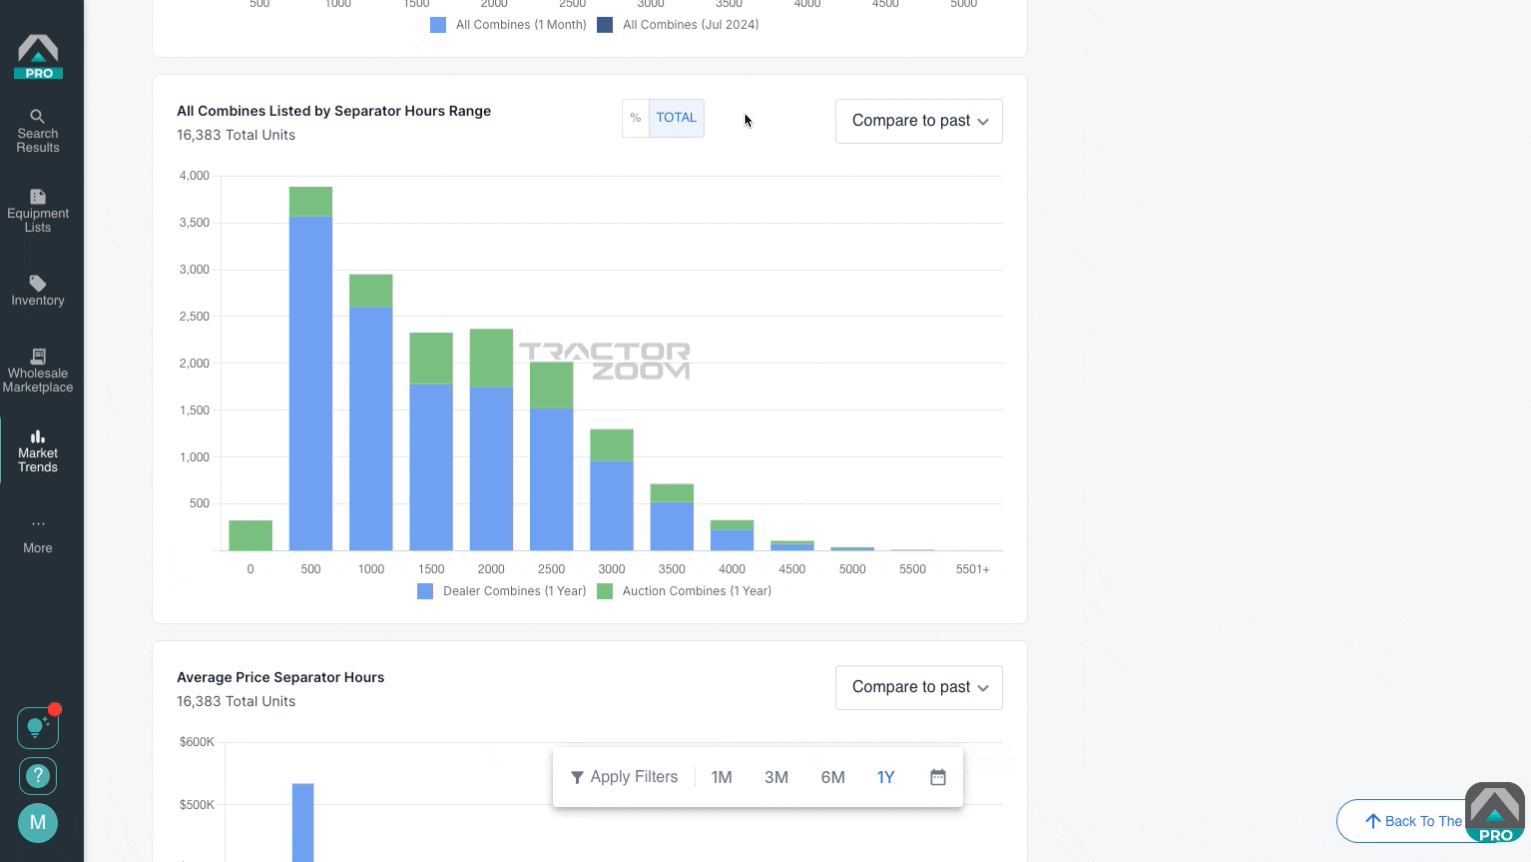
Equipment Listed by Hour Range
This section of Market Trends displays the current supply of your selected category. Toggle the graph to % or TOTAL. Click the Compare to past drop down to select a specific month for price comparison. This graph includes auction supply, which can be selected and de-selected at the bottom of the graph.
Average List Price by Hour Range
Utilize this section of Market Trends to see the current price of your selected make and model by its specific hour range. Note, this is the average list price, not necessarily the sold price. Click the Compare to past drop down to select a specific month for price comparison. This graph includes auction values, which can be selected and de-selected at the bottom of the graph.