Tractor Zoom Pro Market Trends provides real-time and historic average movement of equipment prices. Use this feature to gain insights into specific make and model of machines sold at auction or listed on dealers’ lots, plus analyze the market as a whole.
Subscription levels to Tractor Zoom Pro vary. Depending on your level, you may not see some of the time periods in your Market Trends view. Check your Account Settings if you’re unsure what subscription you have.
Follow this guide to get started on your own.
Equipment Categories
Select a category and sub-category of equipment you’re interested in getting information. All sections of Market Trends reflect the category you choose.
Used Equipment Index
The Used Equipment Index averages sale prices for equipment during a specific month and compares them to a baseline period.
Popular Models
Models with the most volume populate this list, in addition to the average listing price for each model.
Select one day (1D), one month (1M), or three months (3M) to refine the listings.
Click on a model for an expanded view of supply and pricing trends.
Price Changes
The Price Changes section displays equipment make and models that have experienced the most dramatic price changes in the past one week (1W), one month (1M), and three months (3M).
Click on a make and model for an expanded view of pricing trends.
Equipment Advertised by Month
This section displays the volume of equipment in your selected category.
Refine the data by choosing the time frame of one month (1M), three months (3M), six months (6M), one year (1Y), or all time (ALL).
At the bottom of the chart, you can select either Dealer Listings or Auction Listings to display one or the other for a more focused view.
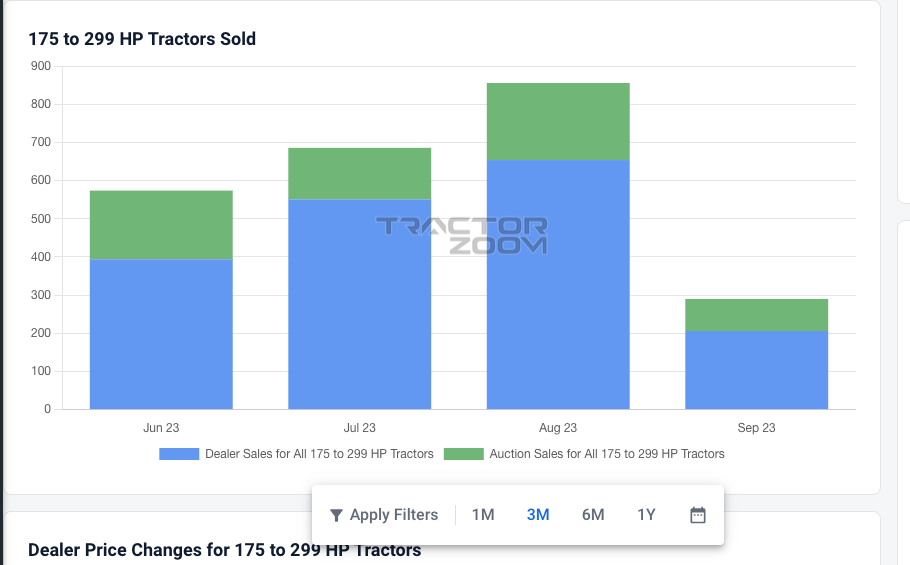
Units Sold
View the supply of units sold by one month (1M), three months (3M), six months (6M), one year (1Y), or all time (ALL).
At the bottom of the chart, you can select either Dealer Listings or Auction Listings to display one or the other for a more focused view of the trends.
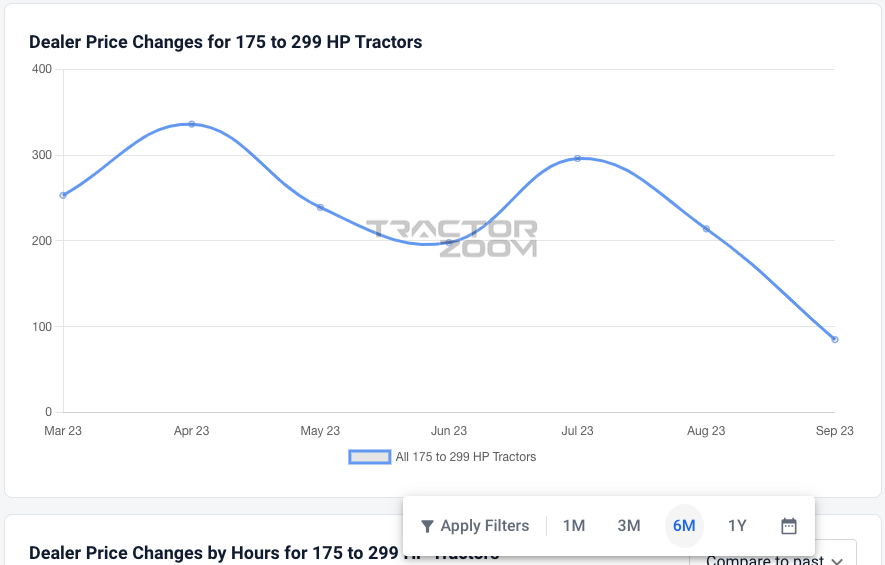
Dealer Price Changes
See the frequency of price changes on your selected category over time. Select one month (1M), three months (3M), six months (6M), one year (1Y), or all time (ALL).
Dealer Price Changes by Hours
This section displays data about equipment price changes depending on the hour range.
Apply Filters to see data across one month (1M), three months (3M), six months (6M), one year (1Y), or a custom range to adjust the time frame. You may also filter by State, Make, and Drive Type. Click the Compare to past drop down to select a specific month for price comparison.
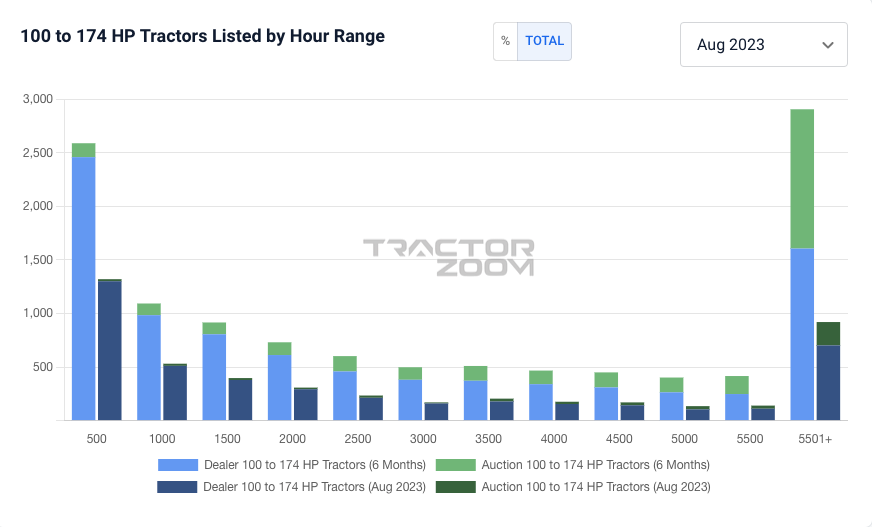
Equipment Listed by Hour Range
This section of Market Trends displays the current supply of your selected category.
Toggle the graph to % or TOTAL.
Apply Filters to adjust the time frame to one month (1M), three months (3M), six months (6M), one year (1Y), or custom and click the Compare to past drop down to select a specific month for price comparison. This graph includes auction supply, which can be selected and de-selected at the bottom of the graph.
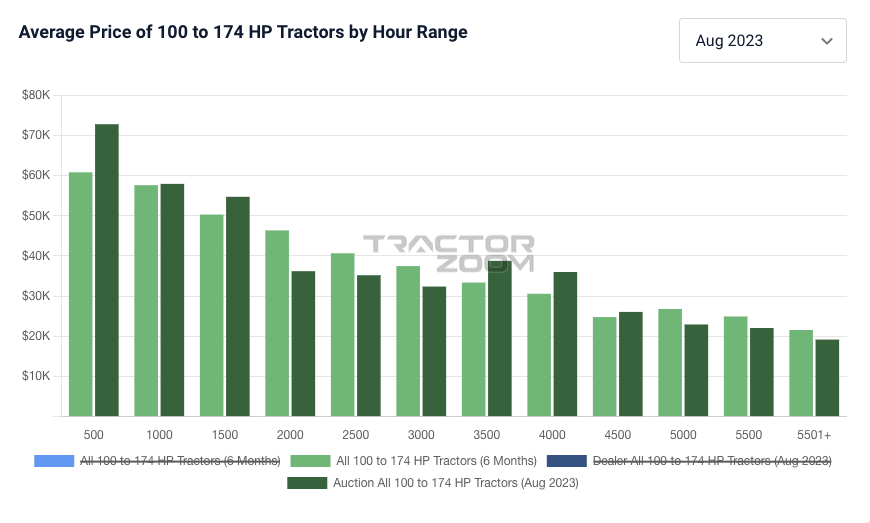
Average List Price by Hour Range
Utilize this section of Market Trends to see the current price of your selected make and model by its specific hour range. Note, this is the average list price, not necessarily the sold price.
Adjust the time frame to one month (1M), three months (3M), six months (6M), one year (1Y), or a custom range and click the Compare to past drop down to select a specific month for price comparison. This graph includes auction values, which can be selected and de-selected at the bottom of the graph.
Listed by State
See the supply of your selected equipment by state.
Refine the map with time frames of one month (1M), three months (3M), six months (6M), one year (1Y), and a custom date range.
Now it’s your turn! Start searching the Tractor Zoom database today and when you’re ready to explore more capabilities, return here to get equipped with the skills you need to make the most of the tools available to you.
Need more help? Reach out to our Customer Success team and we’ll take care of you.